From searches to sneezes: Evaluating digital indicators for allergic rhinitis surveillance in the United Kingdom
IEEE BigData 2024
From Searches to Sneezes: Digital Surveillance for Allergic Rhinitis
J.M.W. Turner — The Burning of the Houses of Lords and Commons (1834) Cleveland Museum of Art · Cleveland Parliament consumed by fire while crowds watch from the Thames — a catastrophe unfolding in full public view, visible from every bridge and bank. Turner painted the spectacle of collapse: what a city sees when its own systems fail, and everyone watches in real time.
The Problem
Allergic rhinitis affects up to 40% of some populations and creates cyclical pressures on healthcare systems every pollen season. Traditional surveillance relies on clinical data that lags behind real-time disease activity, hindering timely interventions. Can digital traces – what people search, tweet, and report on health apps – serve as early warning signals?
The Approach
We analyzed eight years of weekly data from the United Kingdom (January 2016 – January 2024), integrating four digital data sources with clinical AR incidence from GP surveillance networks. We collected Google Trends data for “allergic rhinitis”, “pollen”, and “hay fever”; scraped tweets from X (formerly Twitter) containing the same AR-related terms to build a Twitter Frequency indicator; and incorporated self-reported medication use from the MASK-air mHealth app. We employed Spearman correlations, Granger causality tests, SARIMAX time-series models, linear regression, and Random Forest regression to assess each source’s predictive value.
What We Found
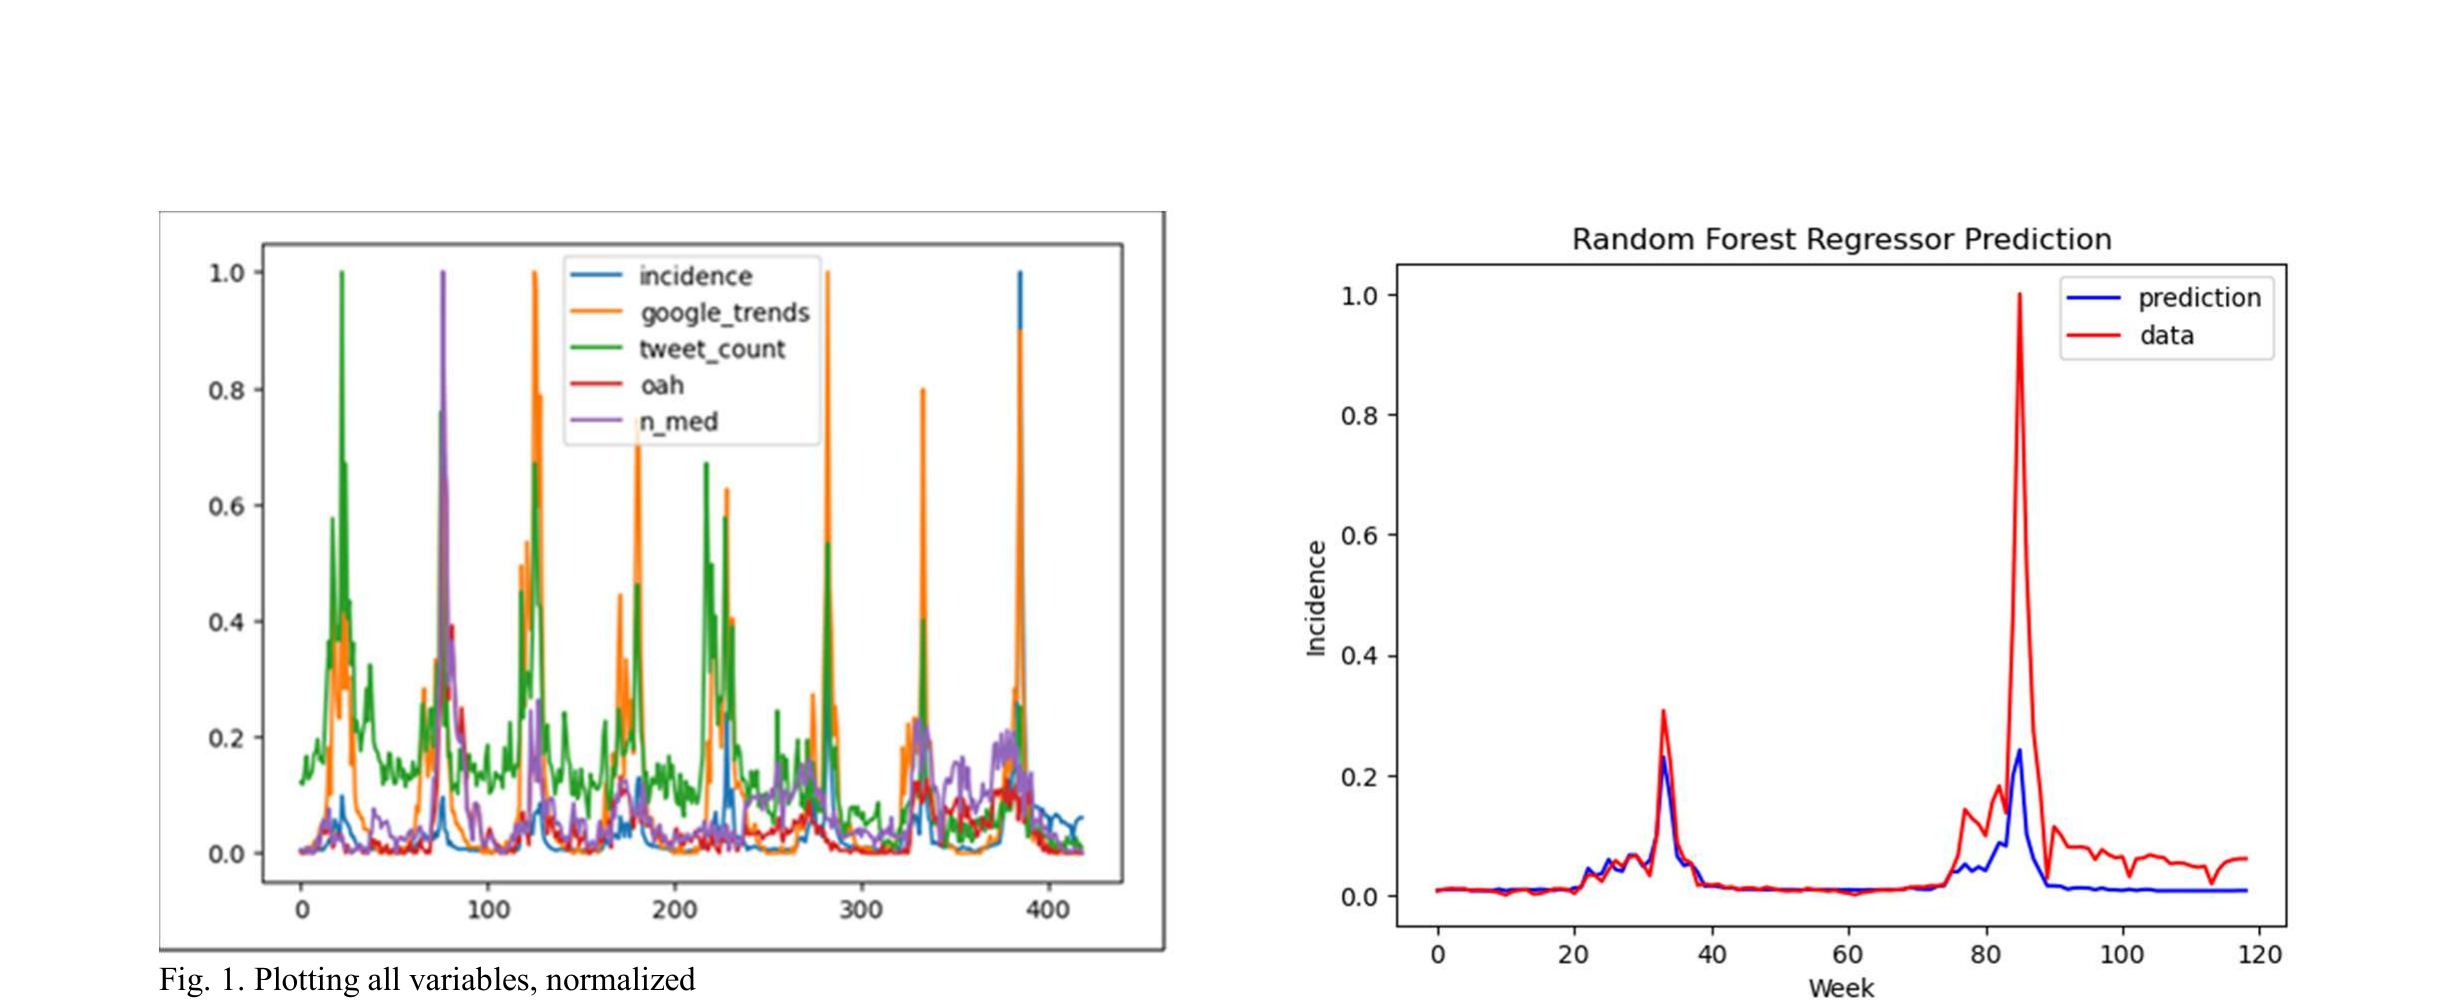
Google Trends dominated at the national level, showing the strongest correlation with AR incidence (0.73) and the highest Granger causality score (10.33), meaning search behavior preceded and predicted clinical cases. Regression models using GT data alone performed nearly as well as combined models. Our scraped Twitter data provided slight but meaningful improvements in test-set performance – and, crucially, offers something Google Trends cannot: geographical specificity. While GT data is limited to national-level trends, geotagged tweets can capture local AR activity, making social media scraping a valuable complement for regional surveillance. Self-reported medication data from the MASK-air app showed weak correlations and did not significantly improve predictions at the national level.
Left: Normalized weekly time series of all digital indicators and clinical AR incidence over 8 years (2016–2024), showing the strong seasonal co-movement of Google Trends with AR incidence. Right: Random Forest regression predictions vs. observed AR incidence on the test set.
Why It Matters
Google Trends data can serve as a powerful, real-time proxy for allergic rhinitis surveillance in the UK – enabling earlier public health responses and better resource planning before clinical data becomes available. Integrating search-based digital indicators into surveillance systems could transform how we monitor and manage seasonal allergic conditions.
Citation
Manohara, K., Jankin, S., Roa, J., Béchara, H., Bousquet, J., Garcia-Corral, P., & Sousa-Pinto, B. (2024). From searches to sneezes: Evaluating digital indicators for allergic rhinitis surveillance in the United Kingdom. In Proceedings of the 2024 IEEE International Conference on Big Data (BigData), Washington, D.C., USA. DOI: 10.1109/BigData62323.2024.10825514
Citation
@inproceedings{k.2024,
  author = {K. , Manohara and S. , Jankin and J. , Roa and H. , Béchara
    and J. , Bousquet and P. , Garcia-Corral and B. , Sousa-Pinto},
  title = {From Searches to Sneezes: {Evaluating} Digital Indicators for
    Allergic Rhinitis Surveillance in the {United} {Kingdom}},
  booktitle = {IEEE International Conference on Big Data (BigData) 2024},
  date = {2024-12-15},
  url = {https://jorgeroac.com/publications/papers/forthcoming/searches-to-sneezes/},
  doi = {10.1109/BigData62323.2024.10825514},
  langid = {en}
}