Homicides in Mexico: Two Decades of Evolution
Programa de Política de Drogas — Policy Brief
Homicides in Mexico: Two Decades of Evolution
José Chávez Morado — La Marcha (1940) Museo de Arte Moderno · Mexico City A nocturnal march of campesinos carrying flags through a darkened landscape — collective movement against a sky that offers no certainty, only the resolve of those who march forward.
Mexico’s national homicide rate doubled over two decades — from 12.8 to 27.4 per 100,000 between 1998 and 2019 — but this aggregate obscures radically different state-level trajectories, from Yucatán’s near-flat stability to Chihuahua’s peak of 184.9 per 100,000. Using a Bayesian longitudinal model, the brief classifies each state by baseline rate and annual growth slope, arguing that effective security policy requires a place-based diagnostic rather than a uniform national response.
The Problem
Lethal violence has become one of Mexico’s most pressing public health crises. For several age groups, homicide ranks as the leading cause of death — above cancer and diabetes (Luviano et al., 2021). Aburto et al. (2016) documented that the post-2008 surge in homicides reversed life expectancy gains for men and slowed those gains for women.
The international comparison is stark. In 2017, Mexico was the third country worldwide by total number of homicides (32,079) and the twelfth by homicide rate (25.7 per 100,000), according to the United Nations Office on Drugs and Crime. That same year, Afghanistan — a country at war — recorded only 2,424 homicides, 13× fewer than Mexico, at a rate of 6.7 per 100,000 (roughly one-quarter of Mexico’s). In 2019, with 33,176 cases, Mexico set its highest absolute number of homicides since 1998. Homicide has remained among the top 10 causes of death in Mexico every year since 2009.
The Approach
We built an annual state-level panel of homicide rates by combining administrative mortality records from the Instituto Nacional de Estadística y Geografía (INEGI) spanning 1998–2019 with annual state population projections from the Consejo Nacional de Población (CONAPO). The homicide rate per 100,000 was computed as total annual homicides divided by the population alive at the start of the year, multiplied by 100,000.
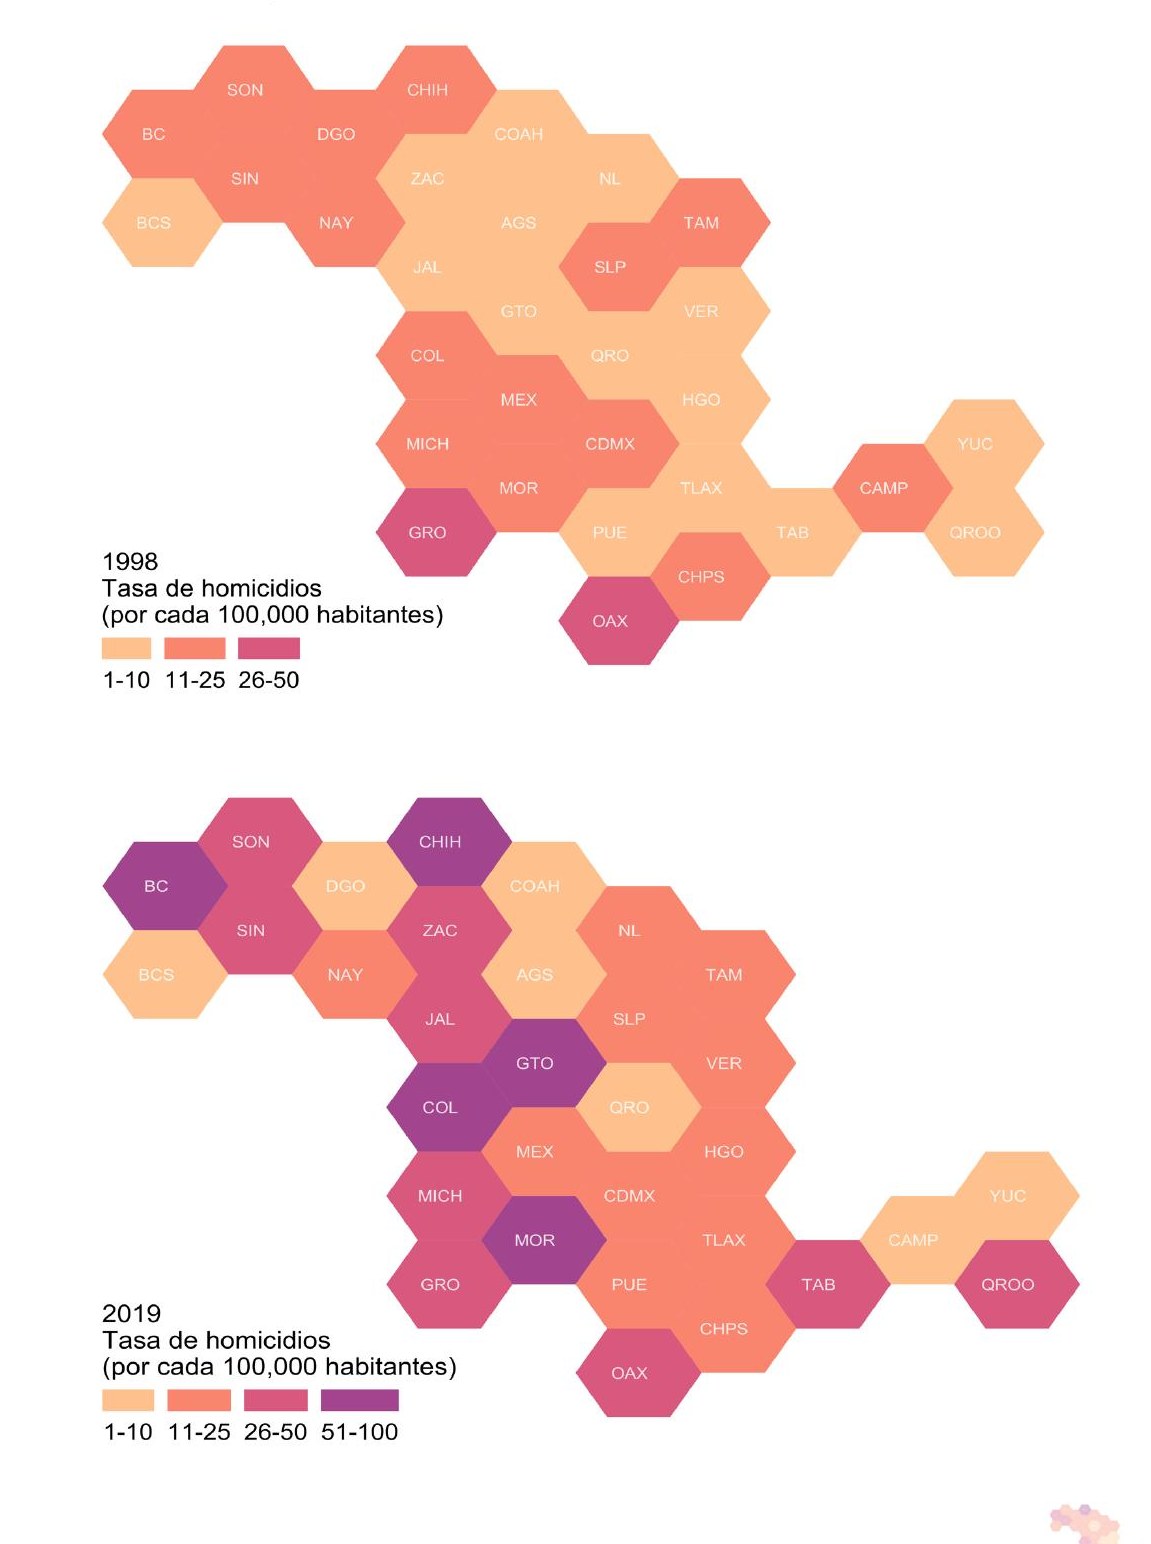
Geographic patterns are visualized using equal-area hexagonal maps that represent every state as the same-sized hexagon — removing the visual bias introduced by states of vastly different physical size and letting the color encoding carry all the spatial information.
To quantify the underlying trend, we fit a longitudinal Poisson regression model with Bayesian inference, recovering an estimated intercept (the 1998 baseline rate) and slope (the annual rate of change) for the national average and for each of the 32 federal entities — together with 95% credible intervals that let us classify each state as below, within, or above the national trajectory.
The National Trajectory
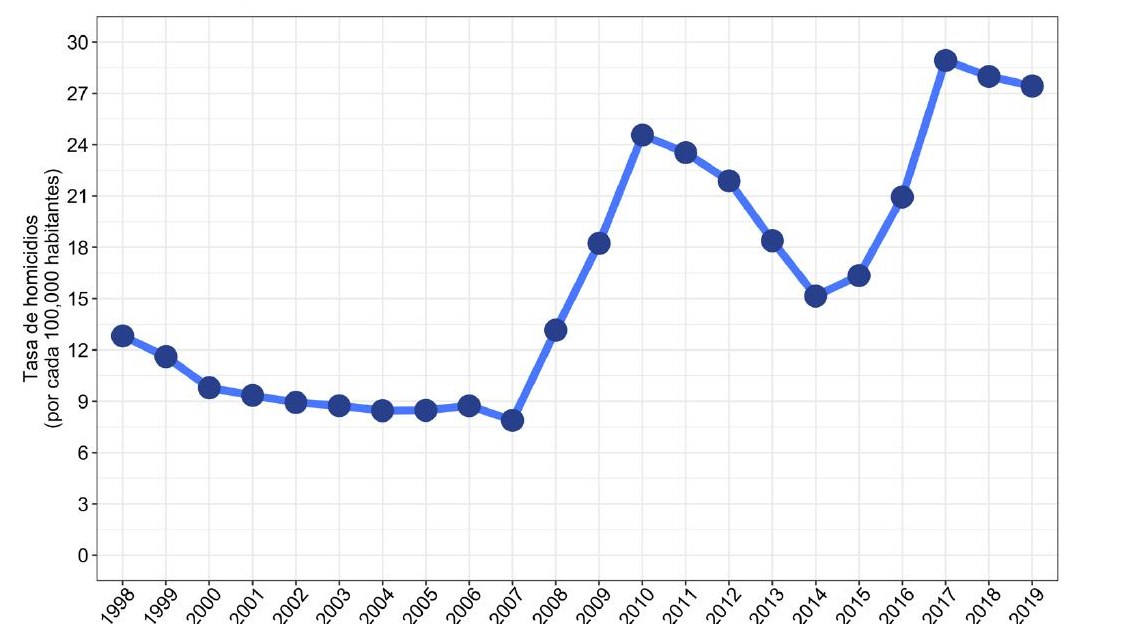
The national rate climbed from 12.82 homicides per 100,000 in 1998 to 27.42 in 2019, but the path between those endpoints was anything but linear. Four distinct phases stand out:
- 1998–2007 — gradual decline. A steady downward drift, bottoming out at the lowest rate of the 21-year period in 2007.
- 2007–2010 — sharp escalation. A rapid surge that tripled the rate to 24.56 per 100,000 by 2010, coinciding with the militarization of the federal anti-drug strategy.
- 2010–2014 — partial reversion. Rates fell back to 15.15 by 2014.
- 2014–2017 — second wave. A renewed climb peaking at 28.92 in 2017 — the most violent year of the period.
- 2017–2019 — modest decline. A small dip to 27.42, but the rate remained near historic highs.
The Bayesian model estimates a national 1998 baseline of 6.61 per 100,000 (95% CrI [5.1, 8.7]) and an annual incidence rate ratio of 1.06 (95% CrI [1.04, 1.07]) — implying ~6% compounded annual growth in the homicide rate.
State-Level Heterogeneity
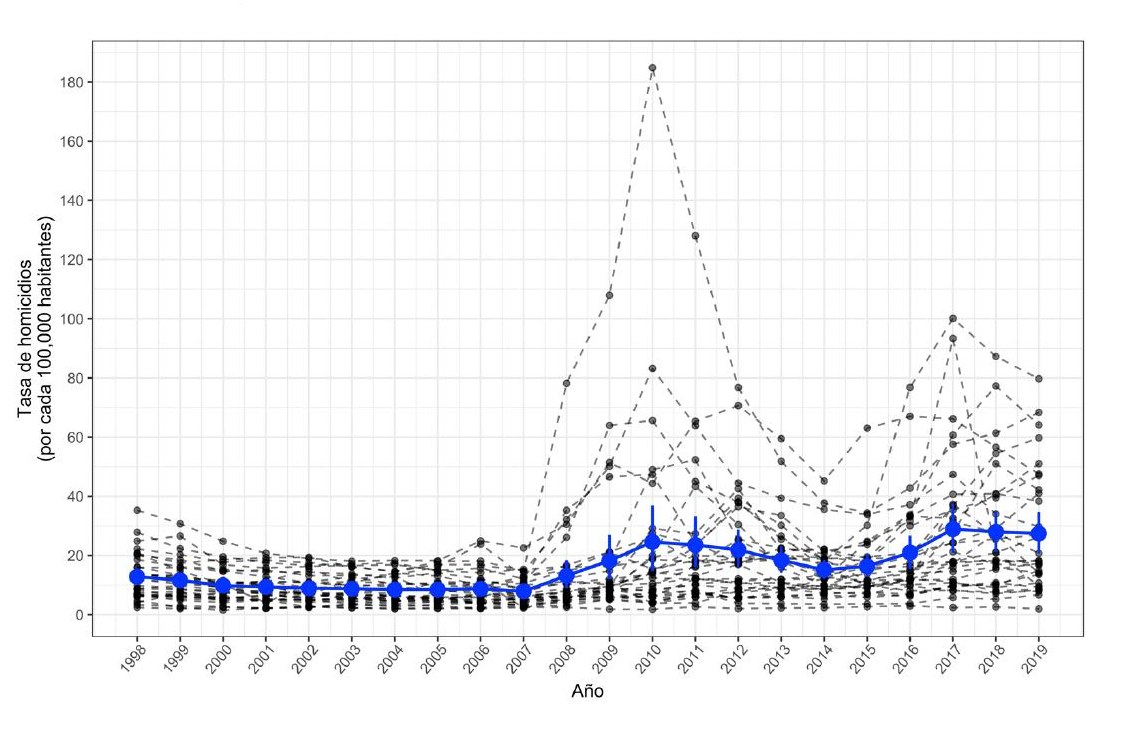
The doubling of the national rate is not a uniform phenomenon — it is the aggregate of highly divergent state trajectories. A handful of states held steady; several exploded.
Stable, low-rate states. Yucatán remained between 1.8 and 2.9 per 100,000 — the most peaceful state across the two decades. Aguascalientes oscillated narrowly between 1.6 and 8.3. Campeche is one of the few states that decreased, falling from 12.5 in 1998 to 7.5 in 2019.
Volatile, fast-growing states. Chihuahua ranged from 14.6 to 184.9 per 100,000, the highest single-year rate in the dataset, peaking in 2010 at the height of the cartel war. Guanajuato rose from 6.7 in 1998 to 59.7 in 2019 — a 9× increase, with sustained growth starting in 2007. Colima swung from a low of 7.0 in 2006 to 100.1 per 100,000 in 2017. Baja California ranged from 12.1 to 77.3, and Baja California Sur — mostly low — spiked to 93.3 in 2017.
The Bayesian model formalizes this heterogeneity along two axes:
- Where states started in 1998 (intercept). Compared to the national 95% CrI, 13 states fall below it, 6 within it, and 13 above it. The five states with the highest 1998 baselines were Chihuahua, Guerrero, Sinaloa, Durango, and Oaxaca; Guanajuato had the lowest.
- How fast they grew (annual rate ratio). 12 states fall below the national interval, 12 within it, and 8 above. The four states with the fastest growth were Guanajuato, Colima, Baja California Sur, and Zacatecas; Chiapas had the slowest.
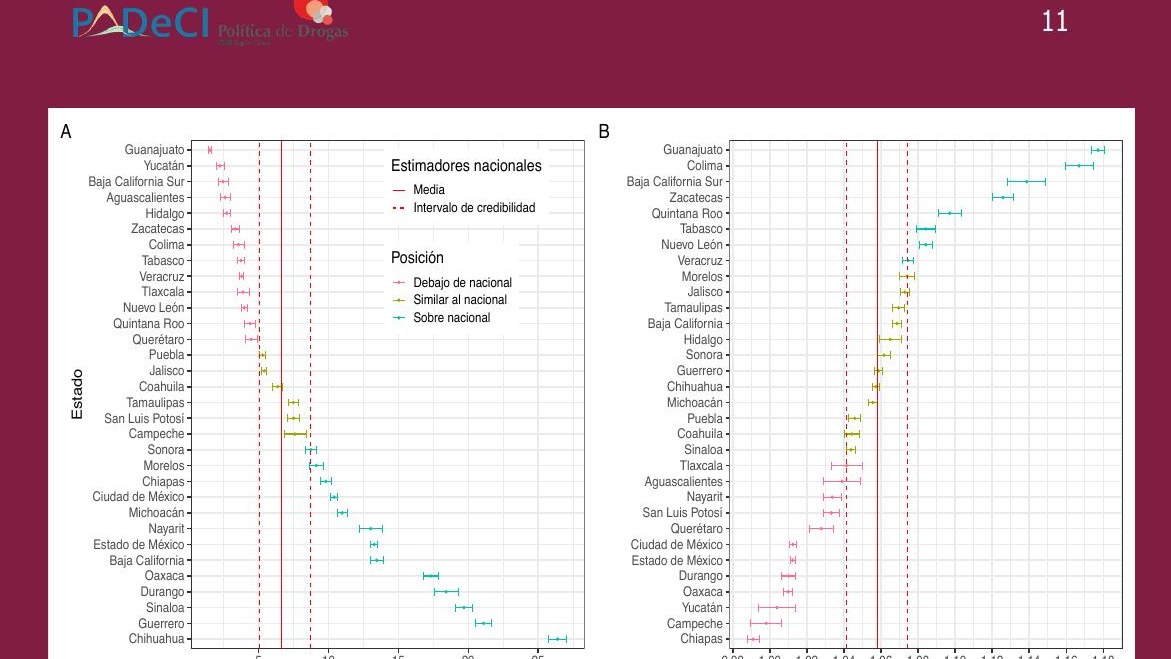
These two dimensions create four meaningful state archetypes — low-and-stable, low-but-rising, high-and-rising, and high-but-slowing — each demanding a different policy response.
Why It Matters
The doubling of Mexico’s homicide rate over two decades is not a single national crisis — it is the aggregation of drastically different state-level trajectories. A small set of states concentrate the most extreme escalations, while others have remained stable or even improved. Public-policy responses that treat homicide as an undifferentiated national emergency miss the dynamics that produce — and could plausibly reverse — the violence. The data point toward a state-by-state diagnostic, anchored in baseline rate, growth slope, and the location of local peaks. Differentiated, place-based policy is not an aesthetic preference; it is what the geographic and temporal evidence demands.
Citation
Peralta, Y., Roa, J., Miranda, A., & Alarid-Escudero, F. (2021). Homicidios en México: Su evolución en las últimas dos décadas. Programa de Política de Drogas (CIDE-PPD), Proyecto de Análisis de Decisiones en Contextos Inciertos (PADeCI).