Show / hide code
01-install.R
install.packages("dampack")                          # CRAN
remotes::install_github("DARTH-git/dampack",         # development version
ref = "dev")Decision-analytic modeling in R

Johannes Vermeer — Woman Holding a Balance (c. 1664) National Gallery of Art · Washington
dampack is a suite of R functions for analyzing and visualizing the health economic outputs of mathematical models. It comes from the DARTH workgroup, and its theory is laid out in Hunink et al. (2014).
Give it the costs and effects that a decision model produces for each strategy. It finds the cost-effectiveness frontier and the incremental cost-effectiveness ratios (ICERs). It propagates parameter uncertainty through probabilistic and deterministic sensitivity analysis. It also measures what resolving that uncertainty would be worth, through value of information.
Every result type has a plot() method, so the same ggplot2-based figures come out of each analysis.
4 Kinds of analysis
24 Exported functions
9 plot() methods, one per result type
| Functions | |
|---|---|
| Costs, effects and ICERs | calculate_icers(), calculate_icers_psa() |
| Probabilistic analysis | make_psa_obj(), run_psa(), gen_psa_samp(), ceac(), calc_exp_loss() |
| Deterministic analysis | run_owsa_det(), run_twsa_det(), owsa(), twsa(), owsa_tornado() |
| Value of information | calc_evpi(), calc_evppi(), calc_evsi(), metamodel() |
Install the release from CRAN, or the development version from GitHub. The example dataset used below ships with the development version:
01-install.R
install.packages("dampack") # CRAN
remotes::install_github("DARTH-git/dampack", # development version
ref = "dev")df_example_psa_elc is a de-identified sample of 10,000 probabilistic analysis draws from a published decision model, with six strategies. As willingness to pay rises, its cost-effectiveness frontier changes the optimal strategy three times. Hand the cost half and the effect half straight to make_psa_obj(), then compute the acceptability curves:
02-ceac.R
library(dampack)
library(ggplot2)

psa <- make_psa_obj(
  cost          = df_example_psa_elc[, 1:6],
  effectiveness = df_example_psa_elc[, 7:12],
  strategies    = paste0("S", 1:6),
  currency      = "$"
)

ceac_obj <- ceac(wtp = seq(0, 60000, by = 500), psa = psa)
plot(ceac_obj, frontier = TRUE, points = FALSE)
Each curve is the probability that a strategy is cost-effective at a given willingness to pay. The white squares mark the strategy on the frontier, the one with the highest expected net benefit, at each value.
The frontier changes hands three times. S5 is optimal first, then S6 from $11,000, S3 from $30,000 and S1 from $41,000 per QALY. A strategy can be optimal without having the highest probability of being cost-effective, which is why the squares do not always sit on the top curve.
The sample supports cost-effectiveness analysis only. The parameter draws behind it were removed, so it cannot be used for metamodeling or EVPPI. Strategy labels are generic.
This figure is not rendered by the page. The dataset is not on CRAN, so the code runs from make-ceac-figure.R in this folder against the development version, and the PNG is committed. That script adds a transparent dark theme to the plot shown above.
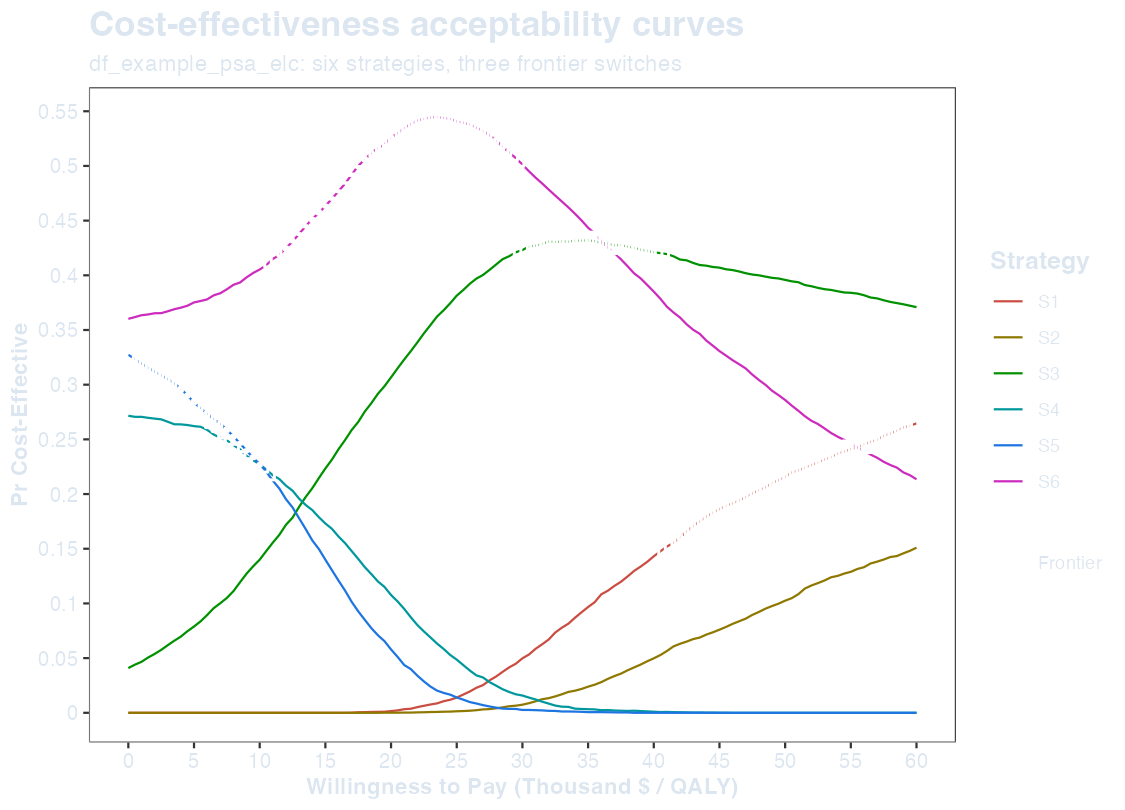
summary() of a ceac object returns the willingness-to-pay interval over which each strategy is optimal, with one row per interval however many times the frontier switches. For the example above:
| range_min | range_max | optimal_strategy |
|---|---|---|
| 0 | 11,000 | S5 |
| 11,000 | 30,000 | S6 |
| 30,000 | 41,000 | S3 |
| 41,000 | 60,000 | S1 |
The third column, optimal_strategy, names the strategy with the highest expected net benefit over that interval.
The package vignettes cover the rest, in this order: basic_cea, psa_analysis, voi, psa_generation and dsa_generation. Open one with vignette("basic_cea", package = "dampack").